


Who is the most formidable attacker in ATP? – A data analysis based on TDI


In the previous four articles, we analyzed the quality of ATP players' serves, returns, forehands, and backhands using the TDI indicator system.
Today, let's focus on offense, utilizing the offensive evaluation metrics within the TDI system to measure and analyze who is the most powerful attacker among ATP players.
1. What indicators does TDI establish for offensive evaluation, and how does it differ from traditional offensive data?
Offense is key to winning matches – whether it's serve offense, forehand offense, backhand offense, or net offense, efficient offense directly pressures opponents, controls match tempo, and even secures winning points outright. For general spectators, evaluating a player's offensive ability often relies only on "number of winners" and "offensive point winning rate," without clarifying "where the player's offensive strengths lie," "why they can attack efficiently," and "how effective different offensive methods are."
The offensive indicators in the TDI system are not a single "offensive point winning rate," but rather a "full-dimensional, multi-scenario" offensive evaluation tool. Its core logic is "covering all offensive scenarios, dissecting offensive details, linking offensive outcomes with strategy," forming a stark contrast to the limitations of traditional offensive data. Traditional offensive data resembles a "simple offensive report card," only telling you "whether offensive points are many"; whereas TDI offensive indicators act like a "detailed offensive analysis guide," informing you "how effective different offensive methods are" and "where offensive strengths and weaknesses lie." This helps professionals enhance offensive capability and allows general spectators to better understand tennis offensive tactics.
2. Three major categories of core offensive indicators, covering "process – outcome – strategy"
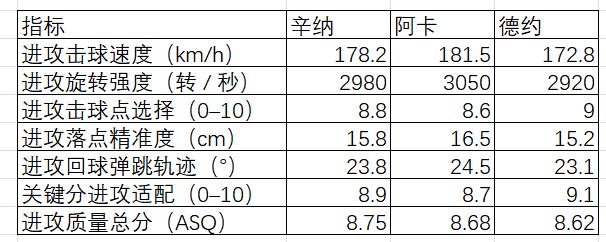
The first category is Offensive Shot Quality (OSQ) indicators. This is the core of offensive metrics, unrelated to offensive point outcomes, focusing solely on the technical quality and threat level of each attacking shot itself. These indicators are calculated based on six core dimensions, covering all offensive scenarios: attacking shot speed, spin intensity, shot selection, placement accuracy, return bounce trajectory, and match context (critical point or regular point). Different offensive methods have varying dimension weights; for example, serve offense emphasizes speed and placement, net offense emphasizes reaction speed and placement control, forehand offense emphasizes power and spin.
The second category is offensive efficiency indicators. These are "result-oriented" metrics, presented as percentages. Their core function is to see whether offensive quality translates into points or advantages, covering all offensive scenarios. They interact with Offensive Shot Quality (OSQ) indicators, explaining "why some players have high offensive quality but low point winning rates."
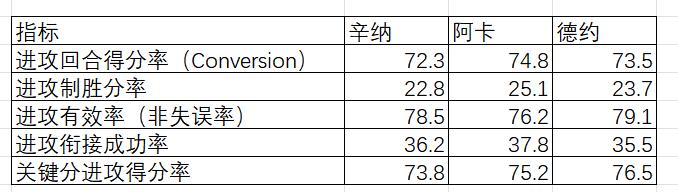
The core indicators in this category are five, listed as follows: (1) Offensive rally point winning rate: the proportion of winning the point in all offensive rallies, higher values indicate stronger overall offensive efficiency; (2) Offensive winner rate: the proportion of attacking shots directly winning the point, reflecting finishing ability; (3) Offensive effectiveness rate: the proportion of attacking shots successfully returned without giving opponents direct counterattack opportunities, reflecting offensive stability; (4) Offensive continuity rate: the proportion of immediately initiating consecutive attacks after an offensive shot, gaining initiative, reflecting offensive coherence; (5) Critical point offensive point winning rate: the proportion of winning points in offensive rallies under critical point scenarios, reflecting offensive stability under pressure.
The third category is offensive tactical distribution indicators. This bridges offensive quality and efficiency, focusing on players' offensive choices and tactical diversity, explaining why, given similar offensive quality, some players score more points while others score less.
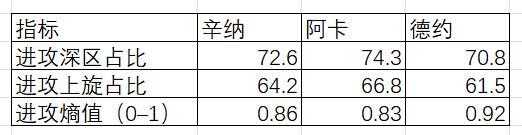
The core indicators in this category are four, listed as follows: (1) Offensive method distribution: the proportion of different offensive methods (forehand, backhand, serve, net), revealing players' offensive emphasis; (2) Offensive placement distribution: the proportion of offensive returns landing in different areas of the opponent's court, reflecting tactical targeting; (3) Offensive spin type distribution: the proportion of spin types for different offensive methods, more spin variations make it harder for opponents to predict; (4) Offensive entropy: measuring unpredictability of offensive methods, placement, and spin, higher entropy indicates more diverse offensive tactics, making it harder for opponents to prepare specifically.
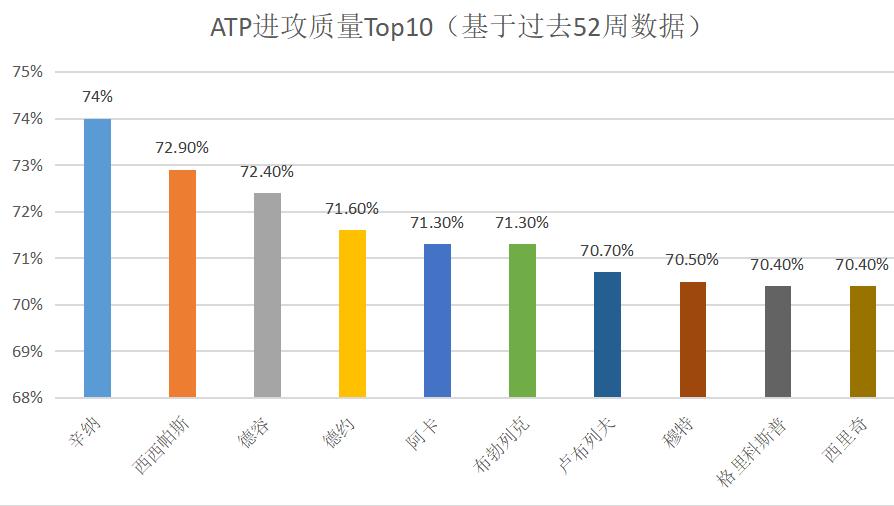
Based on the above three major categories of indicators, ATP lists the Top 10 offensive quality rankings over the past 52 weeks, as shown in the figure below.
3. Comparative analysis of offensive quality indicators for Sinner, Alcaraz, and Djokovic
Combining ATP official public data from the past 52 weeks, we again take Sinner, Djokovic, and Alcaraz as examples, comparing their TDI core offensive indicators. This allows intuitive understanding of TDI offensive indicators' function and clearly reveals differences in their offensive styles.
1. Offensive quality indicators
2. Offensive efficiency indicators
3. Offensive tactical distribution indicators
Through the above three major categories of indicators, assisted by AI, we can analyze the offensive characteristics of these three players.
(1) Quality dimension: Sinner's ASQ total score is highest, with balanced speed, spin, and placement, being a "stable heavy cannon" for baseline offense; Djokovic's shot selection and critical point adaptation are strongest, with top-tier stability and tactical choices; Alcaraz's speed, spin, and bounce are most aggressive, with outstanding finishing ability but slightly lower stability.
(2) Efficiency dimension: Alcaraz leads in offensive rally point winning rate, winner rate, and continuity success rate, having the highest offensive finishing efficiency; Djokovic is strongest in critical point offensive point winning rate and offensive effectiveness rate, with top-tier pressure resistance and stability; Sinner's various efficiencies are balanced, with no obvious weaknesses.
(3) Tactical dimension: Alcaraz has the highest proportion of deep zone and topspin shots, with the strongest offensive aggressiveness; Djokovic has the highest offensive entropy, with the most tactical variations and unpredictability; Sinner has precise placement and spin control, with balanced tactical choices.(Source: Tennis Home Author: Yun Juan Yun Shu)

 Links
Links
 Contact
Address:UNIT 1804 SOUTH BANK TOWER, 55 UPPER GROUND,LONDON ENGLAND SE1 9E
Number:+85259695367
E-mali:[email protected]
 App
App